在进一步深入了解 FlameGraph 时, 可以看到火焰图作为一种通用工具, 不单单可以用于 cpu 热点展示, 还可以用与探测 diskio, memory 等热点消耗情况. 其中在 memory 上的功能引起我的兴趣, 在我日常值班线上巡检过程中, 遇到的不少 memory 使用持续上涨但不知所由的情况, 此时需要设置个环境变量开启 jemalloc profile 功能之后重启实例, 再通过 jemalloc profile 来分析内存分配/释放行为. 所以我一直在寻找有没有更简便的法子可以直接在内存正在上涨的进程上进行操作, 来快速确认下问题; 目前看 memory flame graph 中提供的几个操作就正好可以! memory flame graph 基本思想是通过 tracer 追踪若干涉及到内存分配/释放的 trace point, 记录堆栈, 之后利用 flame graph 来分析. 考虑到我们线上 linux 内核版本暂都不支持 ebpf, 这里以 systemtap 作为 tracer, 以之前在 Greenplum 上遇到的几个 memory leak 问题为案例实践下. 本文提供的 systemtap 脚本适用于 postgres/greenplum.
stap 脚本
postgres/greenplum 在 malloc/free 基础之上构建了 MemoryContext, 并通过 memory context 来管理内存, memory context 类似于一个内存池; 如果我们这里以 malloc/free 作为 trace point 可能会得到失真的效果, 所以这里使用 memory context 内存分配/释放接口作为 trace point; postgres/greenplum 中 memory context 作为一组接口, 其有多种实现, 这里以使用最广泛的 allocset 实现对应的接口作为 tracepoint.
// allocset.stap
global ptr2bt
global ptr2size
global ctxptr2set
global bt_stats
global tmp_ctxptrset
global quit


probe begin {
    println("开始 trace, 13s 后结束\n")
}

probe timer.s(13) {
    quit = 1
}

function check_quit() {
    if (quit) {
        foreach (bt in bt_stats) {
            print_usyms(bt)
            printf("\t%d\n", @sum(bt_stats[bt]))
        }

        exit()
    }
}

function alloc(bt, ptr, size, ctx) {
    ptr2bt[ptr] = bt
    ptr2size[ptr] = size
    bt_stats[bt] <<< size
    ctxptr2set[ctx, ptr] = "1"
}

function free(ctx, ptr) {
    if (ptr in ptr2bt) {
        bt = ptr2bt[ptr]
        size = ptr2size[ptr]

        delete ptr2bt[ptr]
        delete ptr2size[ptr]
        delete ctxptr2set[ctx, ptr]
        bt_stats[bt] <<< -size
        if (@sum(bt_stats[bt]) <= 0) {
            delete bt_stats[bt]
        }
    }
}

probe process("postgres").function("AllocSetAlloc").return {
    check_quit()
    ptr = $return
    bt = ubacktrace()
    size = $size
    ctx = $context

    alloc(bt, ptr, size, ctx)
}

probe process("postgres").function("AllocSetFree").return {
    check_quit()
    free($context, $pointer)
}

probe process("postgres").function("AllocSetRealloc").return {
    check_quit()
    free($context, $pointer)
    bt = ubacktrace()
    alloc(bt, $return, $size, $context)
}

function clear_ctx(ctx) {
    hadseen = 0
    foreach ([ctx1-, ptr1] in ctxptr2set) {
        if (ctx1 == ctx) {
            hadseen = 1
            tmp_ctxptrset[ptr1] = "1"
        } else if (hadseen == 1) {
            break
        }
    }

    foreach ([ptr] in tmp_ctxptrset) {
        free(ctx, ptr)
    }

    delete tmp_ctxptrset
}

probe process("postgres").function("AllocSetDelete").return {
    check_quit()
    clear_ctx($context)
}

probe process("postgres").function("AllocSetReset").return {
    check_quit()
    clear_ctx($context)
}
案例 2
在 Memory leak in ao_truncate_replay 这个案例中, memory leak 出现在 mirror 节点 replay 进程, 在我们运行案例中的复现步骤之后, 可以使用如下命令来追踪下 mirror replay 进程:
$ stap allocset.stap -x ${mirror-replay-pid} -o mirror-replay-stap.out
之后由于 mirror replay 进程的内存分配行为不是很频繁, 噪音不是很多, 我们可以直接根据 mirror-replay-stap.out 的内容便能确定如下只分配不释放内存的问题堆栈了…
$ cat mirror-replay-stap.out
开始 trace, 13s 后结束

 0xf58992 : palloc+0xcd/0x159 [/hidva.com/gpdb/bin/postgres]
 0x13919fb : psprintf+0x80/0x129 [/hidva.com/gpdb/bin/postgres]
 0x1391d21 : GetDatabasePath+0x5f/0x81 [/hidva.com/gpdb/bin/postgres]
 0xfe5635 : ao_truncate_replay+0x37/0x175 [/hidva.com/gpdb/bin/postgres]
 0xfe57c3 : appendonly_redo+0x50/0x96 [/hidva.com/gpdb/bin/postgres]
 0x8b718c : StartupXLOG+0x1d7e/0x2e3a [/hidva.com/gpdb/bin/postgres]
 0xcb38e4 : StartupProcessMain+0xfb/0x105 [/hidva.com/gpdb/bin/postgres]
 0x912a7c : AuxiliaryProcessMain+0x5ae/0x60a [/hidva.com/gpdb/bin/postgres]
 0xcb252a : StartChildProcess+0xf8/0x2cb [/hidva.com/gpdb/bin/postgres]
 0xcacbe2 : PostmasterMain+0x1269/0x12c4 [/hidva.com/gpdb/bin/postgres]
 0xb6d947 : startup_hacks+0x0/0x12 [/hidva.com/gpdb/bin/postgres]
 0x7f174687bb75 : 0x7f174687bb75 [/usr/lib64/libc-2.33.so+0x27b75/0x1c6000]
	5378688
案例 1
在 Memory leak in GpPolicyFetch() 这个案例中, 继续以如上步骤得到 backend-stap.out 文件, 此时由于 memory leak 发生在用户 backend 中, 内存分配/释放行为比较多, 噪音比较大, 需要借助 flame graph 工具,
$ stackcollapse-stap.pl < stap.out > stap.out.folded
$ flamegraph.pl < stap.out.folded > stap.svg
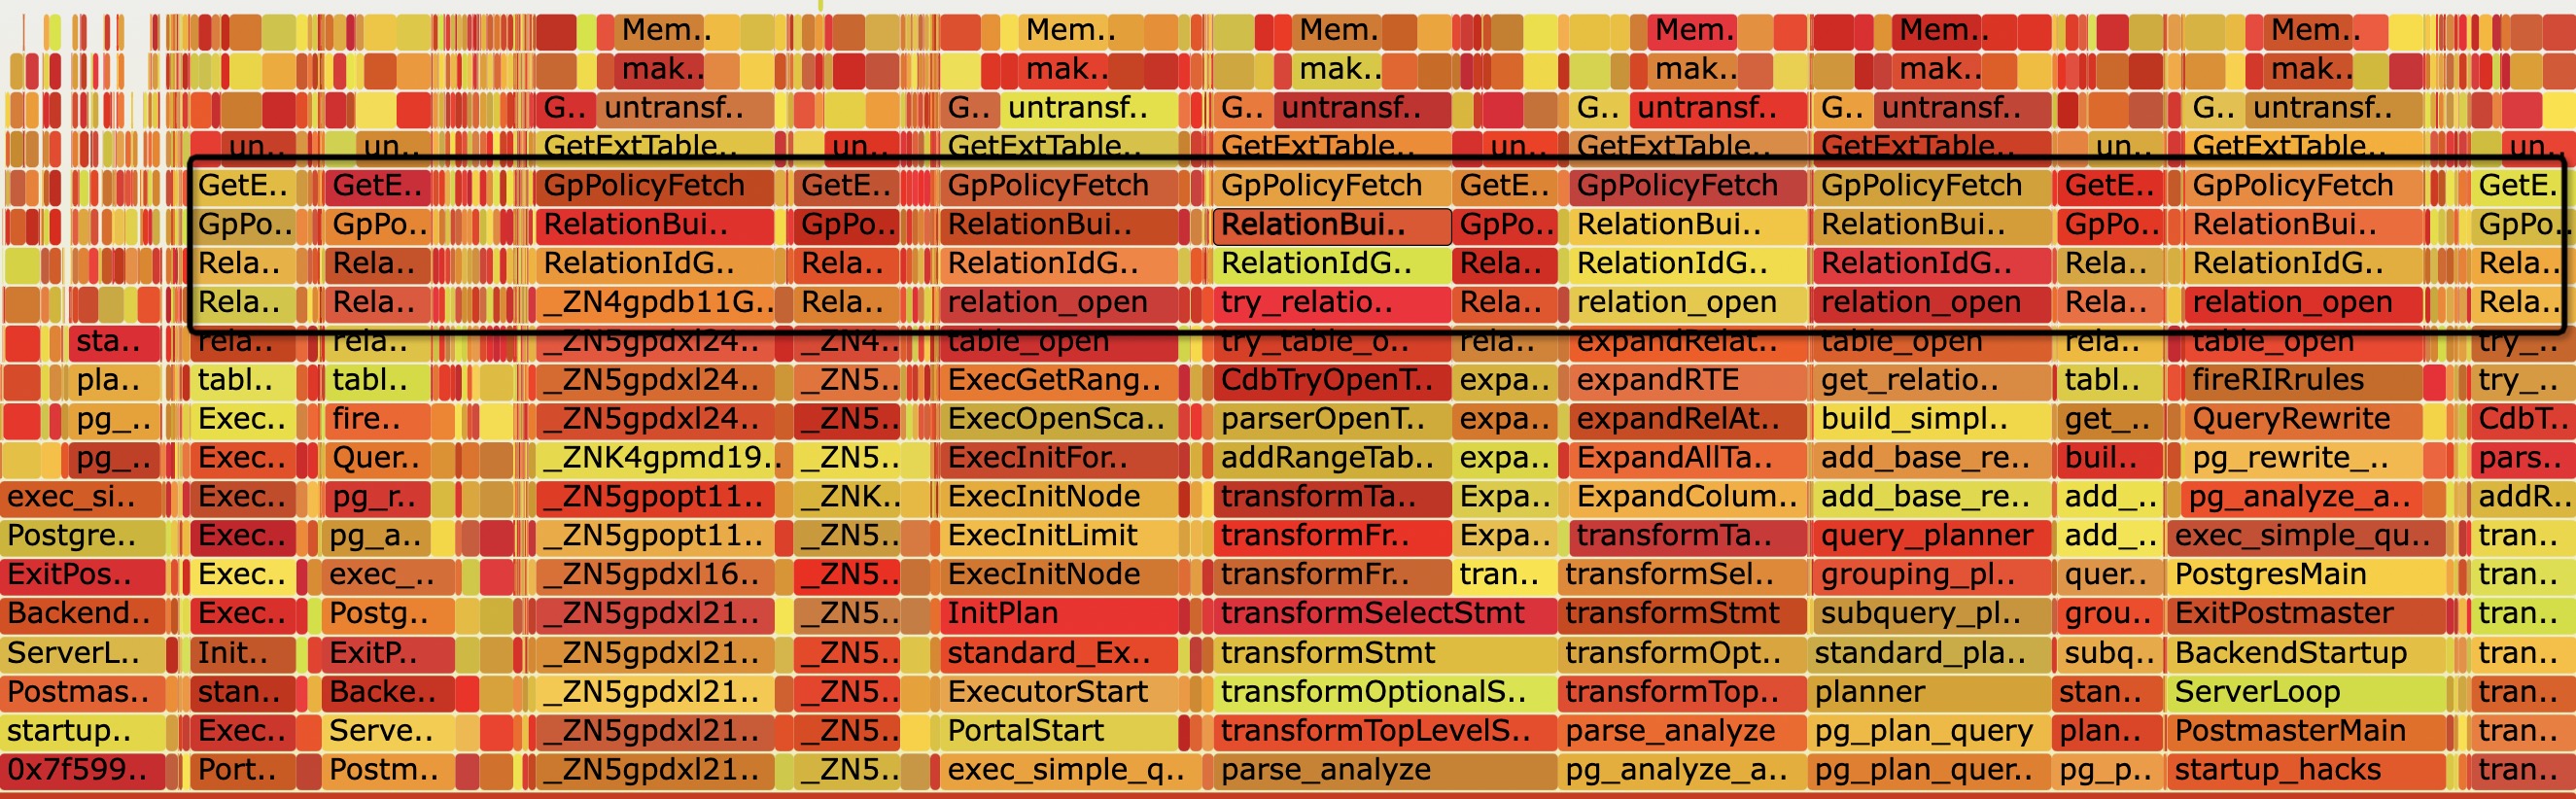
从火焰图中显示的只分配尚未释放的内存图中, 可以依稀看到 RelationIdGetRelation –> RelationBuildDesc –> GpPolicyFetch 这个组合反复出现; 由于 pg/gp 会在多处调用 RelationIdGetRelation, RelationIdGetRelation 底层堆栈变化多端, 导致 flame graph 的 backtrace merge 功能不会很好的合并相似堆栈, 所以我们可以尝试反转下火焰图:
$ flamegraph.pl --reverse --inverted < stap.out.folded > stap.i.svg

emmm… 清晰了一点是吧..
后语
沈腾贾玲的小品可真好看啊